
When a Love Story Meets the Tax Code
Key Points If you ask many engaged couples what’s worrying them before the big day, you’ll probably hear about things like catering
Key Points If you ask many engaged couples what’s worrying them before the big day, you’ll probably hear about things like catering
From vetoing bills to deciding the budget, check out five ways Georgia’s governor impacts schools, safety, work, and public programs that our families and communities
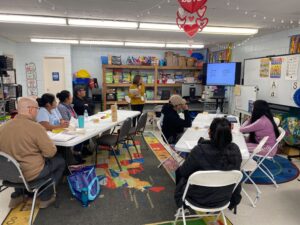
GCO and its partners offered 15 RHCK workshops at 12 locations in 2025. Participants took pre- and post-workshop surveys that illustrated the ways families had
State legislators are paving the way for children to overcome challenges with literacy, empowering them to thrive in their academic development and build flourishing lives

Georgia lawmakers have drafted a pair of bills that are set to transform the way math is taught in the state. If the bills become

The Georgia Center for Opportunity (GCO) is honored to welcome Travis Thorne as the Vice President of Family. Travis will lead GCO’s

The well-being of many Georgians, their families, and their communities is at stake as pressing concerns like welfare reform, the cost of living, educational opportunities,
This collaboration will help lift job seekers above the poverty line by providing opportunities for successful careers and upward mobility.

As Halloween approaches, Georgia families look forward to making great memories involving adorable costumes and fun candy hauls. But candy prices have become nothing short

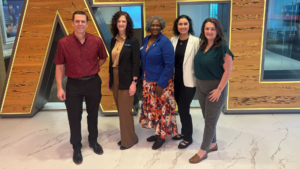
The Georgia Center for Opportunity (GCO) is pleased to welcome two new team members, Mariah Thomas and Angelique Valentine. They will be

Many Georgia counties face high rates of non-working adults, fueling distress and limiting opportunities in struggling communities. See the percentages for your county.

As August ushers in a new school year in Georgia, nearly two million students are headed back to our states 2,300 public schools. How are

A new report on child well-being from Emory University reveals the issues that Georgia parents say are impacting kids—and their futures—most.

Like most states, Georgia’s welfare system is a maze of complex rules and disconnected programs that trap people in a cycle of frustration and dependence.

A new index measuring families’ access to school choice nationwide shows Georgia has our work cut out for us to catch up to Florida, Alabama,

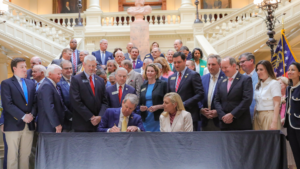
Georgia lawmakers wrapped up the 2025 legislative session with some big decisions that affect our state’s families, students, and workers.

House Bill 136, crafted with research and expertise from the Georgia Center for Opportunity, empowers Kentucky lawmakers with data to make fairer decisions and build

By updating certain job licensing processes for returning citizens, Georgia lawmakers can expand opportunities for meaningful work and better futures.

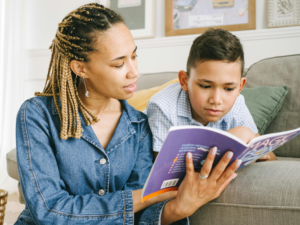
The bond between a parent and child lays the groundwork for emotional security, social skills, academic achievements, and even lifelong decision-making.
The Georgia Promise Scholarship school list is now available. Families zoned for schools on this list meet the attendance zone requirement to apply for the

Big changes are on the horizon for education in Georgia. Starting in the 2025-2026 school year, thousands of families will have greater access to flexible

A new proposal for reform, developed with research by Erik Randolph at the Georgia Center for Opportunity in collaboration with the American Enterprise Institute (AEI),
In state and local elections, voters across the political spectrum chose candidates who shared their priority for greater public safety and order.
A new book, “Doing Right by Kids” features a chapter from GCO’s Josh Crawford on how community violence impacts kids and their opportunities for economic
Local job seekers in the Columbus area might beef up their resumes with the launch of a new initiative. Free job skills
This week, we launched our Jobs for Life program with an inspiring open house, highlighting the life-changing opportunities available to individuals in

Research has found that violent crime negatively affects property values, employment, and outcomes for children. Good public safety policies are a prerequisite for fostering community
A new research paper from GCO shows the ways social safety-net programs like food stamps and Medicaid provide critical support but also discourage career advancement.
By engaging with the building blocks of raising highly capable kids, parents and communities can get kids on a path to enriching relationships, meaningful work,
Georgia has seen a decline in marriage rates, mirroring a national trend and raising important questions about the impact of marriage on personal well-being and